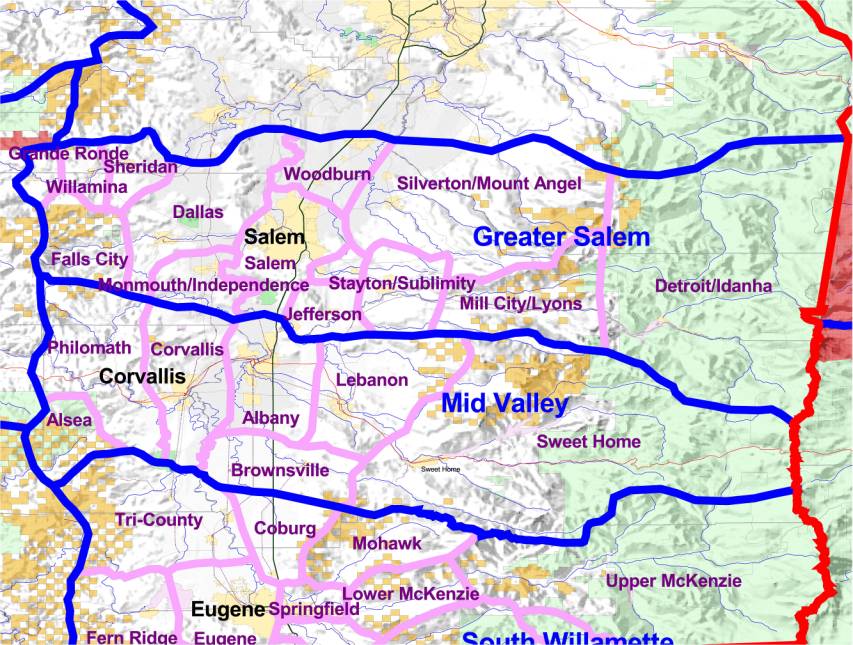
Previous Chapter Table of Contents Next Chapter   
Natural Borders Homepage

Chapter 12

The Mid-Valley Human Resource Unit


This chapter serves to summarize the more detailed descriptions of the seven Community Resource Units (CRUs) that are contained within the Mid-Valley HRU, and that are provided in subsequent chapters. The chapter is divided into the following sections:


A.      A Summary of Cultural Descriptors

B.       Key Findings Related to Community Life

C.       Key Findings Related to Public Lands

D.      A Summary of Citizen Issues Related to Public Lands


Tables Four and Five at the end of this chapter draw upon census data referred to in the following pages.


A. A Summary of Cultural Descriptors

 
Geographic Features


The Mid-Valley Human Resource Unit (HRU) includes all of Benton and Linn counties.  A more precise HRU definition based on census block group identifiers, is found within the 1990-2000bg.xls data file on the distribution CD.  Ten cities are located within this HRU, with the largest being Corvallis (19,630) and Albany (16,108).


Figure 35 shows a map of the unit, stretching from the crest of the Cascades on the east, above Sweet Home and Cascadia to an east-west line to the north of Millersburg, beyond Philomath and Blodgett to the crest of the coastal range on the west, and to an east-west line to the south of Alsea, Monroe, and Brownsville.


The area thus includes National Forest lands in the higher elevations of the Cascades and in the Alsea area, and BLM lands in the lower elevations to the


Figure 35

Map of the Mid-Valley Human Resource Unit (HRU)


east and west side of the valley, but primarily the unit is comprised of the heart of the Willamette Valley, with its flatlands making up the agricultural backbone of the region.


Settlement Patterns


This area was among the first in Oregon to be settled by Europeans. The Willamette River and the fertile soils it created were the major attractions as settlement began. The river became an important source of power and transportation as communities began in Albany, Brownsville, Marysville (Corvallis), and Lebanon. The river became an important social divider as well. Not only did it come to separate Linn and Benton Counties, but it distinguishes east and west valley as well (Highways 99E and 99W, for example).


According to the 2000 census, the Mid-Valley HRU has a total resident population of 171,282 persons, an increase of 12.7% over 1990 levels.  This is a low rate of growth that closely parallels natural increases with little net migration.   Corvallis had a much lower rate of growth (8%), adding 3,733 residents in the decade of the '90s. At a smaller scale, the pattern observed for the Greater Salem HRU is repeated here: modest growth in the urban center, much higher rates of growth in the next ring of flatland towns, and low rates of growth in the very rural or very mountainous communities. Thus,

Philomath and Tangent grew by 22% and 20%, respectively, while Sweet Home only grew by 11% and Brownsville by 7%.


Married couple households declined in proportion from 57.8% to 53.5% of all households during the 1990s.  Growth occurred among single person households (from 13,514 to 16,321) and female headed households (from 4,562 to 5,830).   The proportion of households living in owned homes rose significantly, with 6,835 more homeowners residing in the area in 2000 than in 1990.


Migration patterns have shifted somewhat between the 1985-1990 and 1995-2000 periods tracked by the census bureau. The number of individuals residing in the same house between 1995 and 2000 increased to 75,321 from a total of 62,712 reporting that pattern between 1985 and 1990.   30,532 persons moved to the HRU area between 1995 and 2000, compared to 31,879 from 1985-1990.  There was little change (19,294 to 19,002) in the number of persons moving to the area from other states. 


"We came back here because there's family here. Seattle was too big." [Lebanon; stories like this were very common]


Publics


The age distribution of the HRU changed appreciably through the 1990s.  The median age rose from 34.9 to 35.5, reflecting an aging of the population.  Children between the ages of 5 and 17 declined from 26,798 to 19,607 in 2000.  The older population (ages 65+) grew by 2,786 persons, from 18,943 to 21,729.  The dependency ratio, which measures the balance of children and retirees over those 18 to 65, was little changed, indicating that the labor force population (18-65) also declined comparably. 


The racial composition of the HRU has not changed significantly, with the white population comprising 94.7% of the total in 1990 and 91.7% in 2000.  Hispanics doubled from 3,326 to 7,664, while other racial minorities changed little in their numbers or proportions.


Work Routines


Statistical Review


The average household income in the Mid-Valley HRU grew throughout the area by 57% over the decade.  Retirement income (79%) and income from interest, dividends, and rent (78%) grew nearly twice that rate, reflecting the above noted expansion in the senior population.  Public assistance fell by nearly 14%, as the welfare reforms of the mid-1990s began to take effect.


Homeowners paying mortgages in excess of 30% of their income rose by 2,877 households from 12.4% to 20% of all homeowners.  Renters paying in excess of 30% of their income in rent rose by 2,077 renters from 41.2 to 46% of all renters.


While the overall poverty rate remained almost unchanged for the decade, there were significant racial differences in these patterns.  Hispanics in poverty increased by 131% from 809 to 1,871, while the numbers of Asians and American Indians in poverty actually declined by 23% and 6%, respectively.


Mid-Valley's economy is supported by a healthy mix of industries.  The area's labor force of more than 80,000 workers is dominated by manufacturing (19.2%), educational services (14.5%), and retail trade (10.8%).  Employment in all three of these industries declined during the 1990s, reflecting diversification and the growth in construction and business and health services.  Agriculture and forestry work lost 832 workers during the decade, a decline of 19.8%.


The occupational distribution of the area reflects the presence of Oregon State University and the growth in managerial, professional, and executive occupations.  Employees in the latter group increased 60% from 17,872 in 1990 to 28,663 workers in 2000.  Almost all the other occupational groups declined in dominance as a result of the significant expansion of university and hospital related occupations. 


Benton County's economic base depends on three large employers, each with over a thousand employees - Oregon State University, Hewlett-Packard Corporation, and Samaritan Health Center. These three organizations accounts for about 30% of the Benton County employment (Weber, Bruce, Bruce Sorte and Dave Holland, "Economic Diversity in Benton County: An Input-Output Analysis", Oregon State University Extension Service, Special Report 1034, January 2002).


Linn County's major employers are:


OreMet WahChang, metals processing                      1500

Hewlitt Packard (Corvallis), computer peripherals    1100

National Frozen Foods, frozen vegetables & fruit     500

Golden West, manufactured housing                         415

Weyerhaeuser (Willamette facility), paper              350

Source: Oregon Economic and Community Development Department, Albany Community Profile.


Table Three compares the two counties across a number of indicators.


Table Three

A Comparison of Benton and Linn Counties


Indicator

Benton County

Linn County

Population, 2000

78, 153

103,069

Density/sq.mi.

116

45

Manufacturing facilities

146

274

Principal Industries

Agriculture, lumber, research and development, education

Agriculture and food products, wood products, metals, paper

Top 3 Gross Farm Sales

Specialty products, grass and legume seeds, vegetable crops

Grass and legume seeds, dairy products, specialty products

Per capita wages

$28, 291

$21,709


Source: Oregon Economic and Community Development Department, Albany Community Profile, 2002.


Social Review


The area's natural resource economy (agriculture, timber) has diversified to include high technology manufacturing and related business and research firms, and has been supported by a mobile labor force willing to commute. Economic diversification, a mobile labor force, and the increasing integration of the economy at the regional and global scale have meant enormous changes for lifestyle and livelihood in the Mid-Valley HRU. As described by residents in more detail below, one thing it has allowed is for workers to adjust to changing employment conditions. That is why the decline of timber was not more catastrophic - workers found they could find other work. Although the work was likely to be in an urban area and require commuting, it often paid as well or better than timber work and it provided family benefits and enhanced opportunities for workers' kids.


"Much of my family was in the timber business, and don't you worry. They made their adjustments quickly and they liked it!" [Sweet Home]

Support Services


Housing became less affordable in all communities in the HRU. Corvallis and North Albany have the highest housing costs in the HRU (Analysis of the Regional Economy and Housing for Linn and Benton Counties, ECONorthwest for Cascade West Council of Governments, November, 1999).


B. Key Findings Related to Community Life


1. Commuting has become a basic fact of life for local livelihood and is associated with a more diversified economy integrated regionally and globally.


"As a young person, you can pick and choose because there is such a wide variety of jobs now." [Albany]


"Corporate America is moving in and driving the small businessperson out." [Albany]


"I used to commute but there weren't too many of us. Now, everyone is commuting." [Alsea]


"Nowadays, about 40% of the workers go elsewhere - Albany, Corvallis, and Salem. The improvements to Highway 34 really helped." [Lebanon, Community Development Manager]


"Real estate listings used to be just local, but now they are posted in the region. With housing high in Albany and Corvallis, people realize that they can buy here much more cheaply." [Lebanon]


"Local financial institutions are global now. Nobody makes local decisions." [Lebanon]


"This was a blue-collar town but now it has become commuters." [Philomath]


"Traffic has changed direction. Used to be Corvallis people would drive out here and work in the mills. Now people here drive to town for work." [Philomath]


"We are becoming a bedroom community." [Sweet Home]


2. Strong caretaking systems remain intact and point to the successful cultural absorption of newcomers into Oregon life.


"We help each other out with Christmas lights. My son crawled in a window when he forgot his key and the police were here in 5 minutes. We look out for each other." [Albany]


"There is a big sense of family in the community that keeps many people local." [Albany]


"After the windstorm of February 7, ____ and a friend drove around with a chainsaw, making sure people's driveways were open." [Brownsville]


"My church approached the school district and offered to adopt a school. We began painting classrooms and helping with meals for kids in need. Now other communities are looking at this, especially with the budget cuts." [Lebanon]


3. Quality of Life values are strong.


"Environmental values are strong here. People want economic development that does not pollute." [Corvallis]


"Watch the farmlands so they don't disappear." [Corvallis]


"Farmland is being lost to houses. The best farmland is along the river and that is becoming houses." [Philomath]


4. Racial absorption is here to stay.


"Several homes sold over the last few years and a lot of Mexicans moved in. At first I was very nervous and afraid, but now I realize they are great people, very nice." [Albany]


5. Downtown businesses struggle to remain viable.


"There are no leaders from business at the local level anymore." [Albany]


"Downtown businesses work if you have a unique product and you are very service oriented. You have to have the expertise so people don't go to the big stores." [Albany]


"Downtown really needs assistance." [Albany]


"Many businesses are on the edge right now. There are vacant business buildings. The recession hurt. We have high unemployment locally." [Sweet Home]


"We are seeing the death of the merchant class - our small businesses, our local leadership." [Sweet Home]


6. Affordable housing is a regional issue.


"You can't afford the housing here." [common]


"There are no lots to build on, and if you find one, it costs $40,000-45,000. It's because Corvallis, with its no growth policy, has real estate that's 35% higher than anywhere else." [Albany]


"Affordable housing is a big issue." [Corvallis]


7. Both urban and rural areas struggle with drug and alcohol abuse.


"Drugs, crime, low-income neighborhood. I had to get out of there." [Albany]


"My neighbor got mad at me because I didn't tell them I was going away for a few days. ____ got worried about me and thought something might be wrong." [Albany]


"The drug problems are growing." [Albany, mentioned by almost everyone]


C. Key Findings Related to Public Lands


Recreation Patterns


It is evident from this research that longer-term Oregonians are grieving the loss of public lands from the isolated, casual uses of prior generations. In days gone by, use of the forest was part of everyday routine, often part of work activities. Now, with more people, and more urban people who do not have the day-to-day knowledge of the land, Oregonians see more rules, more density, and more conflicts related to public lands. That is one reason why Forest Recreation passes are so resisted, and when reservations are needed to enjoy a traditionally-used area, then the "older guard" feels supplanted by new times.


Located as pockets within this overarching dynamic are areas that are not as popular as others, where longer-term Oregonians still go and enjoy public lands in relative peace and quiet. The heavily traveled tourist corridors, for example Highways 22 and 126, have become national and international in focus. Highway 20, by contrast, is a corridor still valued and appreciated by longer-term Oregonians.


Findings Identified by Citizens


1. A growing interest and demand for urban based outdoor experiences via parks, trails, bike paths.


"I want to get an interpretive trail going that will stretch from North Albany Middle School along the edge of the nearby woods. I'm not sure how to get funding yet." [Albany]


"People want to do outings closer to home. They want variety and they are interested in education. They want restoration that is reasonable and effective." [Corvallis official]


"We need more outdoor education!" [Corvallis, common]


2. A trend toward more organized outings from urban areas to public lands, especially by the elderly population.


"We had a sleigh ride planned up at Hoodoo this winter. Over 125 people wanted to go, but insurance difficulties caused them to cancel. It was a big disappointment." [Albany]


A number of church youth groups would be interested in forest restoration or river cleanup projects. [Albany]


"There is a scarcity of hikes for older adults. We need better information about trail conditions." [Corvallis, Senior Center Program Coordinator]


D. A Summary of Citizen Issues

Related to Public Lands


Forest Management


"Most people do not want to see the Forest Service cut trees like they did in the past, but people did want to see the pendulum swing a little more back to the middle - away from the seeming policy of 'cut nothing.'" [Albany]


"Some people say this forest can't burn but it's not so. Under the right conditions it would. There's a lot of slash on the ground." [Alsea]


"We need logging. Trees grow old and die. Old growth is rotten on the inside, it must be harvested, too." [Philomath]


"The Siuslaw can produce 300 MMBF [million board feet] a year that could be cut. Our hope is that federal forests will come back to a reasonable level of cut." [Philomath]


"The biggest problem with the decline of federal timber is that the big boys dictate supply and demand. Isn't it ironic that they have in common with environmentalists an incentive to keep things shut down?" [Philomath]


"Siuslaw timber sales maybe shouldn't return. These soils are more sensitive than most and slides in the past were common. The Forest shifted to lighter touch management and it's a good thing." [Philomath]


"I'm disappointed in the Forest Service for allowing environmentalists to control the forest." [Sweet Home]


Access


"There's not enough access to the forest. I got a permit from Willamette once, but the fire watch refused to honor it and I got a ticket for trespassing." [Albany]


"Access is the number one issue for people living in the valley. I hear people complain but there are ways to be proactive. Companies will usually allow you on their land if you sign an insurance waiver. Private gates have phone numbers." [Albany]


"Gates are now everywhere. The public is paying the price for trespass and vandalism." [Sweet Home]


Northwest Forest Pass


"People don't like the Recreation Fee Demo. It's confusing and inconvenient. It is annoying when you get to a site only to find out that you need a permit." [Brownsville]


"People don't mind paying the fees - it's just the lack of information about how to do it." [Brownsville]


It's hard for City employees to purchase Forest Passes. Since the Forest Service isn't set up to bill a business or send an invoice, I have to buy the pass with personal money and then get reimbursed by the City. The process should be streamlined. Why can't I get a yearly invoice so I know I have it ahead of time?" [Corvallis]


"The process for buying permits and passes could be improved. There's got to be a better way. Maybe when people renew their driver's licenses or something." [Corvallis]


"People don't like the Forest Passes because they are not sure the funds are reinvested in a wise manner." [Corvallis]


"Hunters hate the trail park permits. They will intentionally park away from a Forest Service lot and walk in. It would be OK if money was being directly used for the land." [Sweet Home]


Roads


"With the current low level of management, fire and roads are big problems." [Alsea]


Jobs and Economic Development


"We need training for restoration and monitoring. The [Siuslaw National] Forest is not letting restoration contracts." [Alsea]


"The Forest Service needs to hire more people to do the specialty wood products because that is going to be the way of the future. The average Joe cannot afford to pay for the required insurance. The permit requirements for harvesting are too stiff." [Brownsville]


"Their [Forest Service] funds have helped revitalize this community. They have been excellent, responsive." [Sweet Home]


Communication


"We're glad they [Forest Service] come to the watershed council meetings." [Alsea]


"It would be a great service for our customers if we had more information about recreation on public lands and if we could sell permits." [Lebanon]


Table Four

A Demographic Profile of the Mid-Valley Human Resource Unit


Part One:  Based on 100% Count Census Data *


Mid-Valley HRU


1990

2000

1990-2000


Difference

% Change


Total Population

152,000

171,282

19,282

12.7%


Age


Mean Age

34.9

36.48

1.58

4.5%


Population <5

10,215

10,290

75

0.7%


Population 5-17

26,798

19,607

-7,191

-26.8%


Population <18

37,013

40,697

3,684

10.0%


% Population <18

24.4%

23.8%

-0.6%

-2.3%


Population >65

18,943

21,729

2,786

14.7%


% Population >65

12.5%

12.7%

0.2%

1.8%


Dependency Ratio

0.58

0.57

-0.01

-1.7%


Race

151,914

171,282

19,368

12.7%


White

143,839

156,476

12,637

8.8%


% White (One Race)

94.7%

91.4%

-3.3%

-3.5%


Black

813

967

154

18.9%


% Black (One Race)

0.5%

0.6%

0.0%

5.5%


Am. Indian (One Race)

1,554

1,790

236

15.2%


% Am. Indian

1.0%

1.0%

0.0%

2.2%


Asian (One Race)

4,569

4,586

17

0.4%


% Asian

3.0%

2.7%

-0.3%

-11.0%


Other Race (One Race)

1,139

3,135

1,996

175.2%


% Other Race

0.7%

1.8%

1.1%

140.1%


Hispanic (Any Race)

3,326

7,664

4,338

130.4%


% Hispanic

2.2%

4.5%

2.3%

105.5%


Households


Total Households

57,384

66,093

8,709

15.2%


Married Couple Household

33,189

35,359

2,170

6.5%


% Married Couple Households

57.8%

53.5%

-4.3%

-7.4%


Female Headed Households

4,562

5,830

1,268

27.8%


% Female Headed Households

7.9%

8.8%

0.9%

11.4%


Single Person Households

13,514

16,321

2,807

20.8%


% Single Person Households

23.6%

24.7%

1.1%

4.7%


Persons Per Household

2.50

2.50

0.00

0.0%


Families 


Family Households

39,375

43,695

4,320

11.0%


% Family Households

68.6%

66.1%

-2.5%

-3.7%


Persons Per Family

3.10

2.98

-0.12

-3.9%


Families with Related Children

14,627

19,938

5,311

36.3%


% Families with Related Children

25.5%

45.6%

20.1%

78.8%


Housing Units


Total Housing Units

59,622

70,614

10,992

18.4%


Occupied Housing Units

57,242

66,093

8,851

15.5%


% Occupied Housing Units

96.0%

93.6%

-2.4%

-2.5%


Owner-occupied Housing Units

34,502

41,337

6,835

19.8%


% Owner-occupied Housing Units

57.9%

58.5%

0.6%

1.0%


Rental-occupied Housing Units

22,740

24,756

2,016

8.9%


% Rental-occupied Housing Units

38.1%

35.1%

-3.0%

-7.9%


* Above data based on the aggregation of whole block group units of geography to approximate the boundaries of Human


Resource Units. Variables are drawn from 100% count data files for 1990 and 2000 (SSTF1a and SF1, respectively.


Part Two:  Based on Sample Census Data #


Mid-Valley HRU


1990

2000

1990-2000


Difference

% Change


Total Population

151,914

171,261

19,347

12.7%


Migration

141,699

161,151

19,452

13.7%


Same Residence as 5 yrs Ago

62,712

75,321

12,609

20.1%


% Same Residence as 5 yrs Ago

44.3%

46.7%

2.48%

5.6%


Different Residence: Same County

34,271

38,720

4,449

13.0%


% Different Residence: Same County

24.2%

24.0%

-0.16%

-0.7%


Different Residence: Same State

22,323

25,257

2,934

13.1%


% Different Residence: Same State

15.75%

15.7%

-0.08%

-0.5%


Different Residence: Different State

19,294

19,002

-292

-1.5%


% Different Residence: Different State

13.6%

11.8%

-1.82%

-13.4%


Poverty

144,512

165,214

20,702

14.3%


Below Poverty

20,966

21,446

480

2.3%


% Below Poverty

14.5%

13.0%

-1.52%

-10.5%


White Below Poverty

18,433

18,035

-398

-2.2%


% White Below Poverty

13.4%

12.0%

-1.40%

-10.4%


Black Below Poverty

275

209

-66

-24.0%


% Black Below Poverty

38.5%

22.0%

-16.50%

-42.9%


Am. Indian Below Poverty

354

331

-23

-6.5%


% Am. Indian Below Poverty

24.0%

19.0%

-5.00%

-20.8%


Asian Below Poverty

1,584

1,216

-368

-23.2%


% Asian Below Poverty

40.3%

33.0%

-7.30%

-18.1%


Other Races Below Poverty

320

777

457

142.8%


% Other Races Below Poverty

30.7%

27.0%

-3.70%

-12.1%


Hispanic Below Poverty

809

1,871

1,062

131.3%


% Hispanic Below Poverty

25.8%

27.0%

1.20%

4.7%


Industry

68,233

80,044

11,811

17.3%


Agriculture and Forestry

4,199

3,367

-832

-19.8%


% Agriculture and Forestry

6.2%

4.2%

-1.95%

-31.6%


Mining

207

264

57

27.5%


% Mining

0.3%

0.3%

0.03%

8.7%


Construction

3,205

4,836

1,631

50.9%


% Construction

4.7%

6.0%

1.34%

28.6%


Total Manufacturing

14,841

15,329

488

3.3%


% Total Manufacturing

21.8%

19.2%

-2.60%

-12.0%


Transportation

1,870

2,160

290

15.5%


% Transportation

2.7%

2.7%

-0.04%

-1.5%


Communication and Utilities

1,198

377

-821

-68.5%


% Communication and Utilities

1.8%

0.5%

-1.28%

-73.2%


Wholesale Trade

1,813

1,935

122

6.7%


% Wholesale Trade

2.7%

2.4%

-0.24%

-9.0%


Retail Trade

11,293

8,635

-2,658

-23.5%


% Retail Trade

16.6%

10.8%

-5.76%

-34.8%


Finance, Insurance, Real Estate

2,544

3,054

510

20.0%


% Finance, Insurance, Real Estate

3.7%

3.8%

0.09%

2.3%


Business Services

2,562

5,971

3,409

133.1%


% Business Services

3.8%

7.5%

3.70%

98.7%


Recreation/Entertainment Services

737

1,184

447

60.7%


% Recreation/Entertainment Services

1.1%

1.5%

0.40%

36.9%


HealthServices

4,410

8,378

3,968

90.0%


% HealthServices

6.5%

10.5%

4.00%

61.9%


Education Services

10,710

11,575

865

8.1%


% Education Services

15.7%

14.5%

-1.24%

-7.9%


Other Professional Services

4,604

3,442

-1,162

-25.2%


% Other Professional Services

6.7%

4.3%

-2.45%

-36.3%


Public Administration

2,374

2,941

567

23.9%


% Public Administration

3.5%

3.7%

0.19%

5.6%


Occupation

68,233

80,044

11,811

17.3%


Managerial, Professional, and Executive Occupations

17,872

28,663

10,791

60.4%


% Managerial, Professional, and Executive Occupations

26.2%

35.8%

9.62%

36.7%


Technical, Sales, and Administrative Occupations

18,863

17,772

-1,091

-5.8%


% Technical, Sales, and Administrative Occupations

27.6%

22.2%

-5.44%

-19.7%


Service Occupations

9,107

12,267

3,160

34.7%


% Service Occupations

13.3%

15.3%

1.98%

14.8%


Farming, Forestry, and Fishing Occupations

3,744

1,566

-2,178

-58.2%


% Farming, Forestry, and Fishing Occupations

5.5%

2.0%

-3.53%

-64.3%


Precision Production, Craft, and Repair Occupations

7,168

6,955

-213

-3.0%


% Precision Production, Craft, and Repair Occupations

10.5%

8.7%

-1.82%

-17.3%


Operators, Fabricators, and Laborers

11,479

12,821

1,342

11.7%


% Operators, Fabricators, and Laborers

16.8%

16.0%

-0.81%

-4.8%


Income


Aggregate Household Income

$1,816,769,000

$3,296,585,000

$1,479,816,000

81.5%


Average Household Income

$31,660

$49,748

$18,088

57.1%


Average Family Income

$37,279

$58,589

$21,310

57.2%


Per Capita Personal Income

$12,183

$19,584

$7,401

60.7%


Wage and Salary Income

$29,441

$45,664

$16,223

55.1%


% Wage and Salary Income

93.0%

91.8%

-1.20%

-1.3%


Nonfarm Self-employment income

$13,887

$21,044

$7,157

51.5%


% Nonfarm Self-employment income

43.9%

42.3%

-1.56%

-3.6%


Interest, Dividend, and Rent Income

$5,294

$9,506

$4,212

79.6%


% Interest, Dividend, and Rent Income

16.7%

19.1%

2.39%

14.3%


Social Security Income

$8,259

$11,932

$3,673

44.5%


% Social Security Income

26.1%

24.0%

-2.10%

-8.1%


Public Assistance Income

$3,709

$3,195

-$514

-13.9%


% Public Assistance Income

11.7%

6.4%

-5.29%

-45.2%


Retirement Income

$9,470

$16,893

$7,423

78.4%


% Retirement Income

29.9%

34.0%

4.05%

13.5%


Other Income

$3,560

$7,131

$3,571

100.3%


% Other Income

11.2%

14.3%

3.09%

27.5%


Commuting Time

66,800

78,747

11,947

17.9%


Average Commuting Time to Work

18

20

2

10.6%


Commute <10 minutes

16,530

17,553

1,023

6.2%


% Commute <10 minutes

24.7%

22.0%

-2.75%

-11.1%


Commute >60 minutes

2,603

3,419

816

31.3%


% Commute >60 minutes

3.9%

4.0%

0.10%

2.7%


Nativity


Foreign Born

6,957

9,159

2,202

31.7%


% Foreign Born

4.4%

5.0%

0.60%

13.6%


Citizen Not Born in US

1,333

1,843

510

38.3%


% Citizen Not Born in US

0.9%

0.9%

0.00%

0.0%


Born in State Other Than Oregon

72,847

79,045

6,198

8.5%


% Born in State Other Than Oregon

48.0%

46.0%

-2.00%

-4.2%


School Status


Not in School (Ages 3+)

96,912

111,117

14,205

14.7%


% Not in School

66.3%

67.0%

0.70%

1.1%


Highest Educational Attainment


< 9th Grade Education

5,492

4,516

-976

-17.8%


% < 9th Grade Education

5.9%

4.0%

-1.90%

-32.2%


HS Graduates (25+ Population)

24,794

27,135

2,341

9.4%


% HS Graduate

26.8%

25.0%

-1.80%

-6.7%


Graduate or Professional Degree

9,482

12,443

2,961

31.2%


% Graduate or Professional Degree

10.2%

12.0%

1.80%

17.6%


English Language


Speaks Only English (Ages 5+)

133,153

148,719

15,566

11.7%


% Speaks Only English

94.0%

92.0%

-2.00%

-2.1%


Children 5-17 Speak Only English

25,793

28,171

2,378

9.2%


% Children 5-17 Speak Only English

96.2%

93.0%

-3.20%

-3.3%


Labor Force Participation


Male Labor Force Participation Rate

0.701

0.702

0.001

0.1%


Female Labor Force Participation Rate

0.537

0.564

0.027

5.0%


Female Participation Rate (w/children <18)

0.65

0.699

0.049

7.5%


Female Participation Rate (w/children <6)

0.563

0.613

0.050

8.9%


Female Participation Rate (No children <18)

0.489

0.51

0.021

4.3%


School Dropouts


Youth 16-19 Not In School

1,761

1,819

58

3.3%


% Youth 16-19 Note In School

16.6%

15.0%

-1.60%

-9.6%


Youth Unemployment


Youth 16-19 Unemployed

360

280

-80

-22.2%


% Youth 16-19 Unemployed

3.4%

2.0%

-1.40%

-41.2%


Seniors

18,943

21,711

2,768

14.6%


65+ In Group Quarters

793

875

82

10.3%


% 65+ In Group Quarters

4.2%

4.0%

-0.16%

-3.7%


Male 65+ Living Alone

955

1,323

368

38.5%


% Male 65+ Living Alone

5.0%

6.0%

1.00%

20.0%


Female 65+ Living Alone

4,136

4,515

379

9.2%


% Female 65+ Living Alone

21.8%

21.0%

-0.80%

-3.7%


Self-care Limitation  


Self-care Limitation (Total Population)

1,929

3,481

1,552

80.5%


% Self-care Limitation

1.6%

3.0%

1.40%

87.5%


65+ With Self-care Limitation

651

1,830

1,179

181.1%


% 65+ With Self-care Limitation

8.2%

11.0%

2.80%

34.1%


Transportation to Work


Drive Alone to Work

48,663

59,226

10,563

21.7%


% Drive Alone to Work

72.8%

75.0%

2.20%

3.0%


Use Public Transportation to Work

436

707

271

62.2%


% Use Public Transportation to Work

0.7%

1.0%

0.30%

42.9%


Labor Force


Unemployed

4,911

5,665

754

15.4%


% Unemployed

4.1%

4.0%

-0.10%

-2.4%


Worked 35+ Hours Per Week

62,318

69,072

6,754

10.8%


% Worked 35+ Hours Per Week

52.5%

51.0%

-1.50%

-2.9%


Persons Per Occupied Housing Unit

2.4

2.5

0.1

4.2%


Average Value Owned Housing Unit

$67,153

$162,227

$95,074

141.6%


Mortgage


Average Value Monthly Mortgage

$676

$1,151

$475

70.3%


Mortgage > 30% of Income

3,032

5,909

2,877

94.9%


% Mortgage > 30% of Income

12.4%

20.0%

7.60%

61.3%


Rent


Gross Rent > 30% of Income

9,064

11,141

2,077

22.9%


% Gross Rent > 30% of Income

41.2%

46.0%

4.80%

11.7%


Average Monthly Cash Rent

$398

$636

$238

59.8%


Renters Paying No Cash Rent

650

752

102

15.7%


% No Cas Rent

3.0%

3.0%

0.00%

0.0%


Utilities


Housing Units Using Utility Gas

17,550

25,773

8,223

46.9%


Housing Units Using Electricity

24,244

31,596

7,352

30.3%


Housing Units Not Using Utility Gas or Electric

15448

13228

-2,220

-14.4%


% Housing Units Not Using Utility Gas or Electric

27.0%

18.7%

-8.25%

-30.6%


Plumbing


Occupied Housing Units Without Complete Plumbing Facilities

271

236

-35

-12.9%


% Occupied Housing Units Without Complete Plumbing Facilities

0.5%

0.3%

-0.12%

-26.5%


Telephone


Housing Units With Telephone

54,948

65,167

10,219

18.6%


% Housing Units With Telephone

96.0%

99.0%

3.00%

3.1%


Vehicle Available


Housing Units With Vehicle Available

53,271

61,815

8,544

16.0%


% Housing Units With Vehicle Available

93.1%

94.0%

0.90%

1.0%


#  Above data based on the aggregation of whole block group units of geography to approximate the boundaries of Human


Resource Units. Variables are drawn from Sample data files for 1990 and 2000 (STF3a and SF3, respectively).


Part Three:  Based on County Level Data +


Personal Income


Mid Valley HRU


1991-2000


1991

2000

Difference

Change


Total Personal income (thousands of dollars)

$2,768,547

$4,597,924

$1,829,377

66.1%


 Per capita personal income

$33,882

$51,713

$17,831

52.6%


  Nonfarm personal income

$2,707,781

$4,556,809

$1,849,028

68.3%


  Farm income

$60,766

$41,115

-$19,651

-32.3%


 Income from Earnings

$1,749,137

$2,928,327

$1,179,190

67.4%


 Per capita net earnings

$21,477

$33,058

$11,581

53.9%


 Income from Transfer payments

$388,159

$648,929

$260,770

67.2%


 Per capita transfer payments

$4,569

$6,962

$2,393

52.4%


 Income from Dividends, interest, and rent

$631,251

$1,020,668

$389,417

61.7%


 Per capita dividends, interest, and rent

$7,838

$11,693

$3,855

49.2%


  Private earnings

$1,353,911

$2,420,534

$1,066,623

78.80%


   Ag. services, forestry, fishing, & other 8/

$36,607

$77,257

$40,650

111.00%


   Mining

$518

$1,484

$966

186.50%


   Construction

$95,283

$185,495

$90,212

94.70%


   Manufacturing

$546,557

$928,456

$381,899

69.90%


   Transportation and public utilities

$81,453

$145,709

$64,256

78.90%


   Wholesale trade

$64,626

$104,176

$39,550

61.20%


   Retail trade

$160,016

$251,203

$91,187

57.00%


   Finance, insurance, and real estate

$43,319

$108,059

$64,740

149.40%


   Services

$325,532

$618,695

$293,163

90.10%


 Government and government enterprises

$433,254

$630,484

$197,230

45.50%


  Federal, civilian

$56,547

$63,445

$6,898

12.20%


  Military

$11,082

$12,643

$1,561

14.10%


  State and local

$365,625

$554,396

$188,771

51.60%


   State

$190,333

$260,996

$70,663

37.10%


   Local

$175,292

$293,400

$118,108

67.40%


Full and Part Time Employment


Mid-Valley HRU


1991-2000


1991

2000

Difference

Change


Total full-time and part-time employment

44,959

55,213

10,254

22.8%


 Wage and salary employment

35,446

43,745

8,299

23.4%


  Farm proprietors' employment

2,253

2,277

24

1.1%


  Nonfarm proprietors' employment 2/

7,260

9,191

1,931

26.6%


  Farm employment

3,385

3,087

-298

-8.8%


  Nonfarm employment

41,574

52,126

10,552

25.4%


   Private employment

35,560

45,157

9,597

27.0%


    Ag. services, forestry, fishing, & other 3/

921

1,668

747

81.1%


    Mining

21

53

32

152.4%


    Construction

2,318

3,442

1,124

48.5%


    Manufacturing

10,512

11,039

527

5.0%


    Transportation and public utilities

1,840

2,713

873

47.4%


    Wholesale trade

1,657

2,021

364

22.0%


    Retail trade

6,987

9,164

2,177

31.2%


    Finance, insurance, and real estate

1,996

2,583

587

29.4%


    Services

9,308

12,474

3,166

34.0%


   Government and government enterprises

6,014

6,969

955

15.9%


    Federal, civilian

513

369

-144

-28.1%


    Military

446

360

-86

-19.3%


    State and local

5,055

6,240

1,185

23.4%


     State

441

577

136

30.8%


     Local

4,614

5,663

1,049

22.7%


Federal Transfer Payments


Mid Valley HRU


1991-2000


1991

2000

Difference

Change


Total transfer payments

$388,159

$648,929

$648,929

167.2%


 Government payments to individuals

$366,127

$613,807

$613,807

167.6%


  Retirement & disability insur. benefit pymts.

$190,694

$300,342

$300,342

157.5%


  Medical payments (Medicare, etc)

$94,770

$193,613

$193,613

204.3%


  Income maintenance (SSI, Food Stamps, etc.)

$35,626

$57,480

$57,480

161.3%


  Unemployment benefit payments

$20,578

$19,568

$19,568

95.1%


  Veterans benefit payments

$12,330

$22,587

$22,587

183.2%


  Fed ed.& train. assist. paymts.(excl.vets)

$11,241

$19,406

$19,406

172.6%


 Payments to nonprofit institutions

$11,460

$20,556

$20,556

179.4%


 Business payments to individuals

$10,572

$14,566

$14,566

137.8%


Farm Income and Expenses


Mid Valley HRU


1991-2000


1991

2000

Difference

Change


Total cash receipts from marketings ($000)

$96,826

$150,082

$53,256

55.0%


  Cash receipts: livestock and products

$17,104

$12,942

-$4,162

-24.3%


  Cash receipts: crops

$79,722

$137,140

$57,418

72.0%


  Government payments

$1,432

$1,962

$530

37.0%


Total production expenses

$96,046

$142,586

$46,540

48.5%


Total value of inventory change

-$2,042

-$740

$1,302

-63.8%


Total net income including corporate farms

$21,370

$27,278

$5,908

27.6%


Total net farm proprietors' income

$18,466

$22,126

$3,660

19.8%


Agriculture and Farming


Mid Valley HRU


1987-97


1987

1997

Difference

Change


Farms (number)

2,569

2,735

166

6.5%


Land in farms (acres)

516,484

524,211

7,727

1.5%


Land in farms - average size of farm (acres)

397

376

-21

-5.3%


Market value of agricultural products sold ($1,000)

$145,713

$244,417

$98,704

67.7%


Market value of agricultural products sold, average per farm (dollars)

$108,165

$183,414

$75,249

69.6%


Total farm production expenses@1 ($1,000)

$117,240

$172,366

$55,126

47.0%


Total farm production expenses@1, average per farm (dollars)

$88,357

$125,682

$37,325

42.2%


Livestock and poultry:  Cattle and calves inventory (number)

49,033

46,888

-2,145

-4.4%


Beef cows (number)

14,069

15,403

1,334

9.5%


Milk cows (number)

7,723

7,139

-584

-7.6%


Cattle and calves sold (number)

25,605

29,455

3,850

15.0%


Hogs and pigs inventory (number)

6,285

4,179

-2,106

-33.5%


Sheep and lambs inventory (number)

76,926

67,164

-9,762

-12.7%


Wheat for grain  (bushels)

1,675,187

735,527

-939,660

-56.1%


Oats for grain  (bushels)

127,773

291,861

164,088

128.4%


Hay-alfal,oth tame,small grain,wild,grass silage,green chop,etc(see txt)(tons,dry)

72,256

126,104

53,848

74.5%


Vegetables harvested for sale (see text) (acres)

19,012

20,494

1,482

7.8%


Business Patterns


Mid Valley HRU


1991-2000


1991

2000

Difference

Change


Employees

47,188

61,138

13,950

29.6%


Annual Payroll ($000)

$936,569

$1,808,341

$871,772

93.1%


Establishments

3,942

$4,489

547

13.9%


Crime

Mid Valley HRU


1990

1999

Diff90-99

%90-99


All Crimes

8,650

8,363

-287

-3.4%


All Crimes / 100,000

5,338

4,542

-796

-14.9%


Murders 

4

2

-2

-100.0%


Murders / 100,000

2

1

-1

-56.0%


Rapes

79

42

-37

-88.1%


Rapes / 100,000

49

23

-26

-53.2%


Robberies 

65

58

-7

-12.1%


Robberies / 100,000

40

32

-9

-21.5%


Agg.Assaults

294

281

-13

-4.6%


Agg.Assults / 100,000

181

153

-29

-15.9%


Burglaries 

1,730

1,320

-410

-31.1%


Burglaries / 100,000

1,068

717

-351

-32.8%


Larcenies  

5,968

6,209

241

3.9%


Larcenies / 100,000

3,683

3,372

-311

-8.4%


Veh.Thefts  

424

379

-45

-11.9%


Veh.Thefts / 100,000

262

206

-56

-21.3%


Arsons  

86

72

-14

-19.4%


Arsons / 100,000

53

39

-14

-26.3%


Mid Valley HRU


Inmigration*

1990

1999

Diff90-99

%90-99


* Number of IRS Filers moving to Oregon, by county of destination


Inmigrants

1770

1,463

-307

-17.3%


% of State Total

5.1%

3.9%

-1.2%

-23.7%


+  Above data based on the aggregation of whole county units of geography to approximate the boundaries of Human Resource Units.


Greater Salem HRU = Clackamas, Marion, and Polk counties.  Mid-Valley HRU = Benton and Linn counties.  South Willamette HRU

 = Lane County.


Table Five


    Previous Chapter Table of Contents Next Chapter   
Natural Borders Homepage